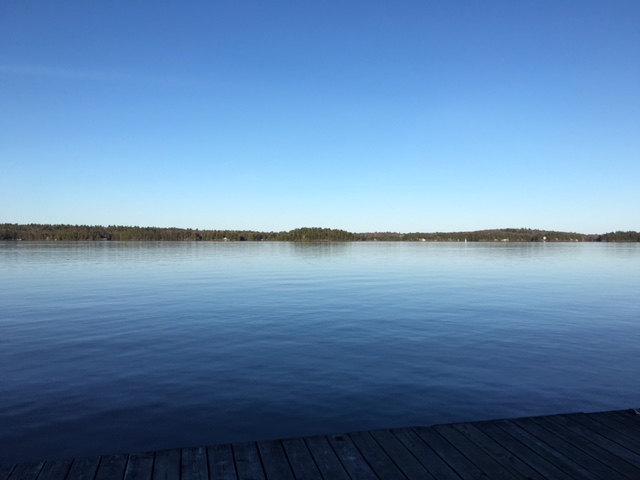
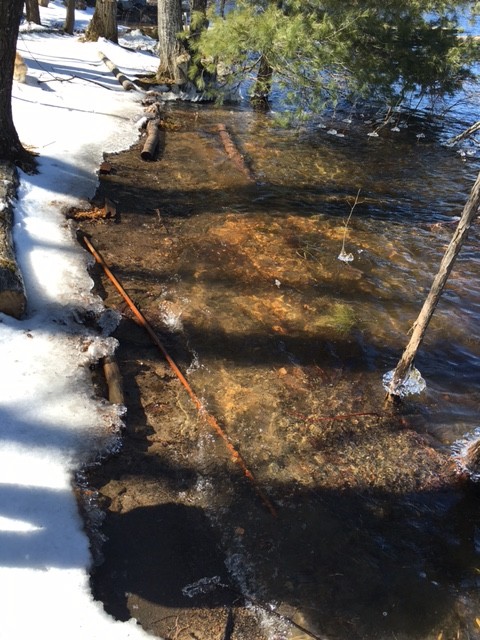
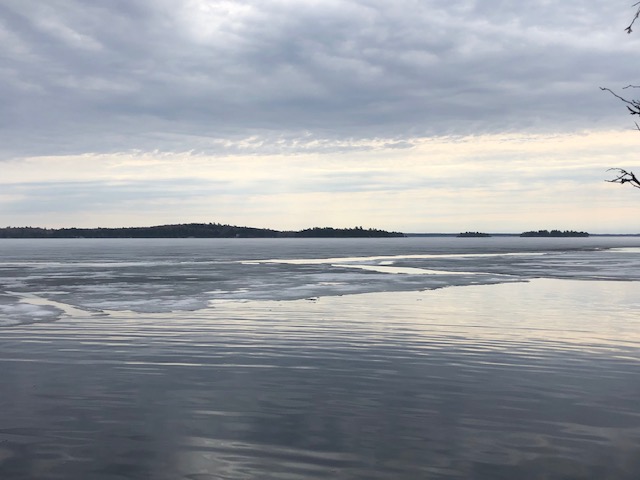
Spring may have sprung, or in the case of last weekend, summer, but today is far more exciting than any day yet because docks have resurfaced on Lake Muskoka! That’s right no more this …
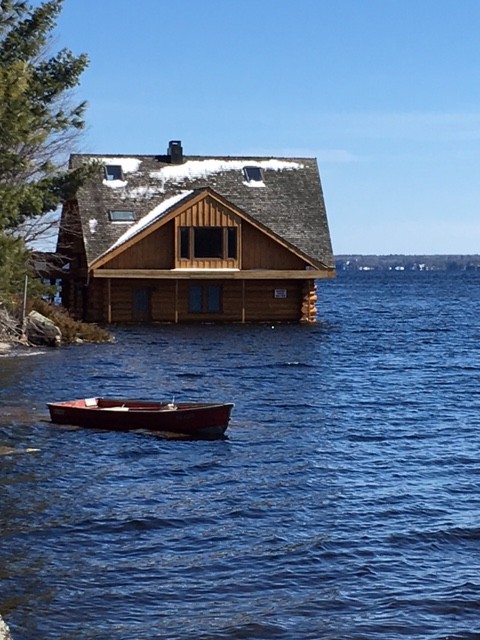
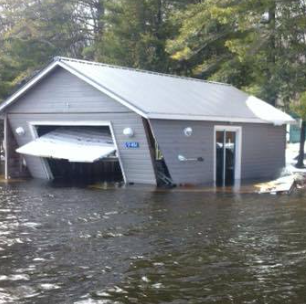
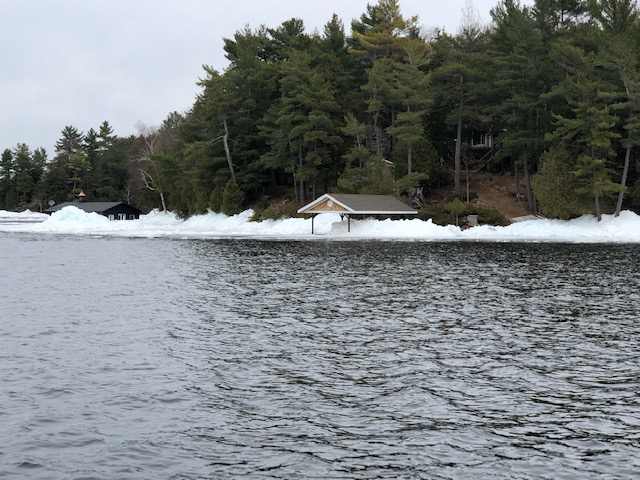
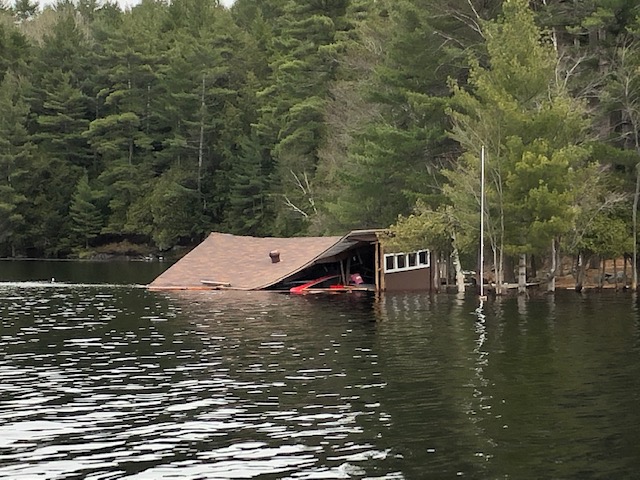
While it could have been alot worse in the end, and very few folks will arrive to find scenes like this
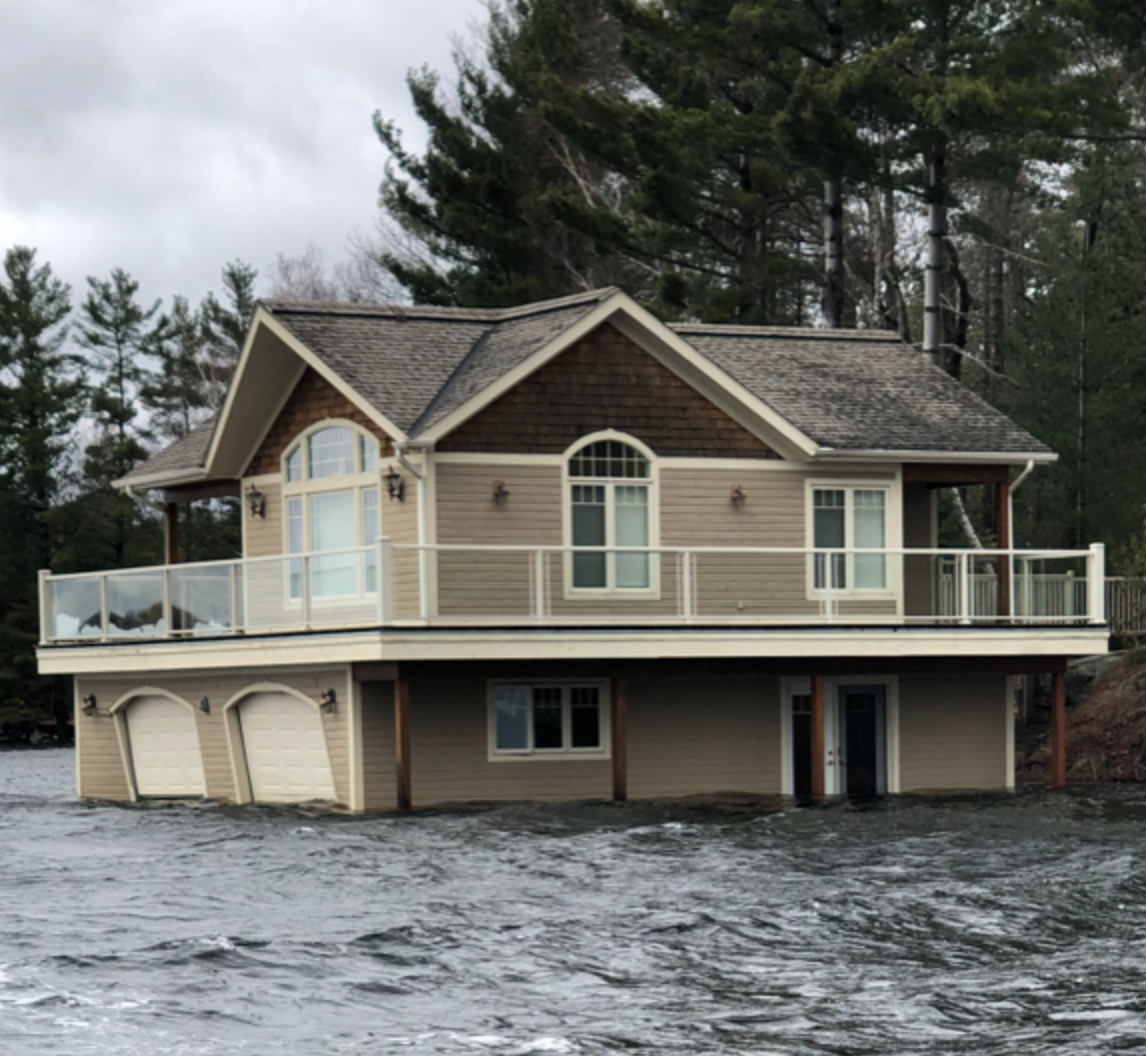
rather more like this, it just’s a reminder that this could have been EASILY prevented or at the very least minimized!
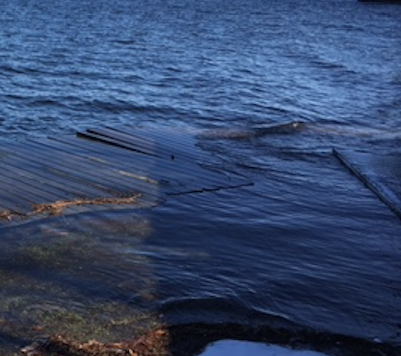
As of today, Tuesday, April 19th the water is back at 384.5″ (the dock we use for all comparisons is at 384″), slightly earlier than the 2 week flood forecast the MNR warned us of thankfully!
There has been no flurry of blame game or mismanagement talk in the weeks past to avoid ending up in these shoes next spring or anytime for that matter. We’re not going to remotely attempt to recap the “theories” we did ask the MNR who manages the lake level 3 simple questions
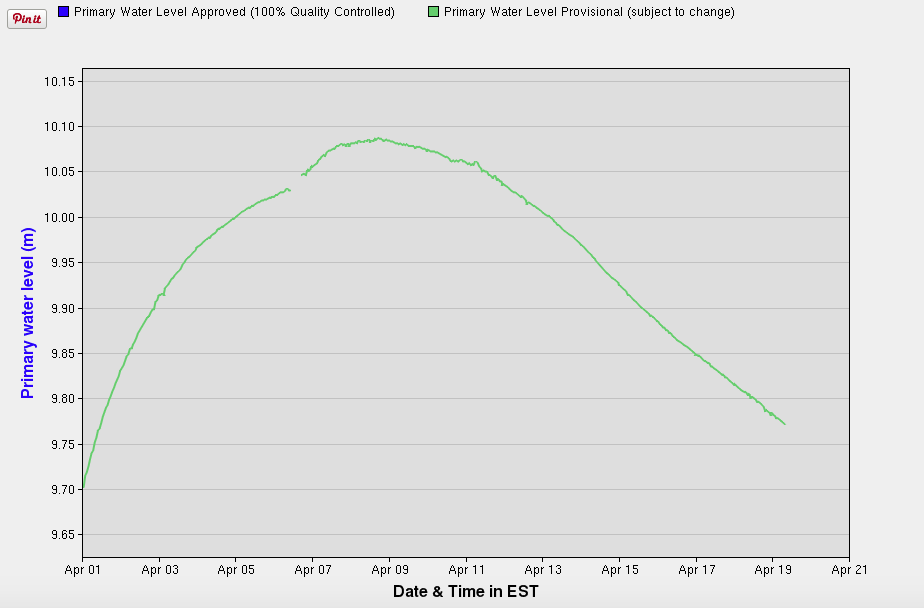
Q1: What tools do you use to measure the lake level?
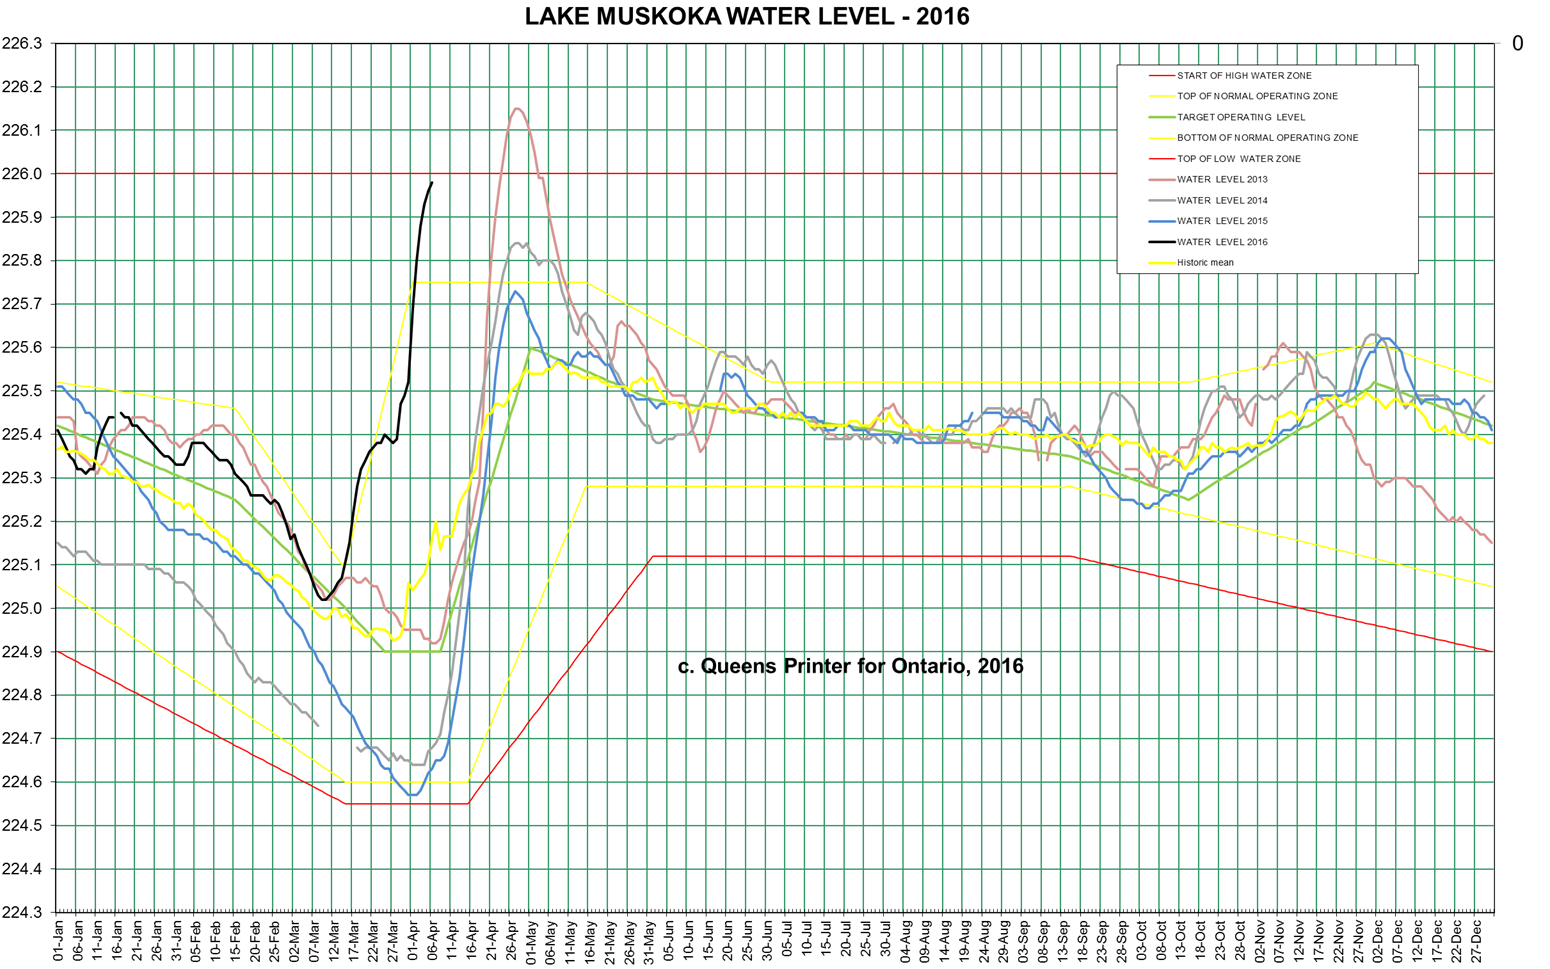
 A1: Yellow Lines on the above chart. Normal operating zone (NOZ) is between the two fainter yellow lines. As you can see by this years black line there was a big whoops. Interesting to note that we have the chart from last year and the NOZ has remained relatively unchanged for several decades. Apparently they missed the global warming note; the world doesn’t work like it used to.
Q2. How do you decide how much to drawdown?
A2: The extent of the winter drawdown is determined by the snow water content in the local snow pack.
Aside: Up until looking last year even I didn’t understand how this whole watershed worked but just so we’re all on the same page and can make educated statements check this out.
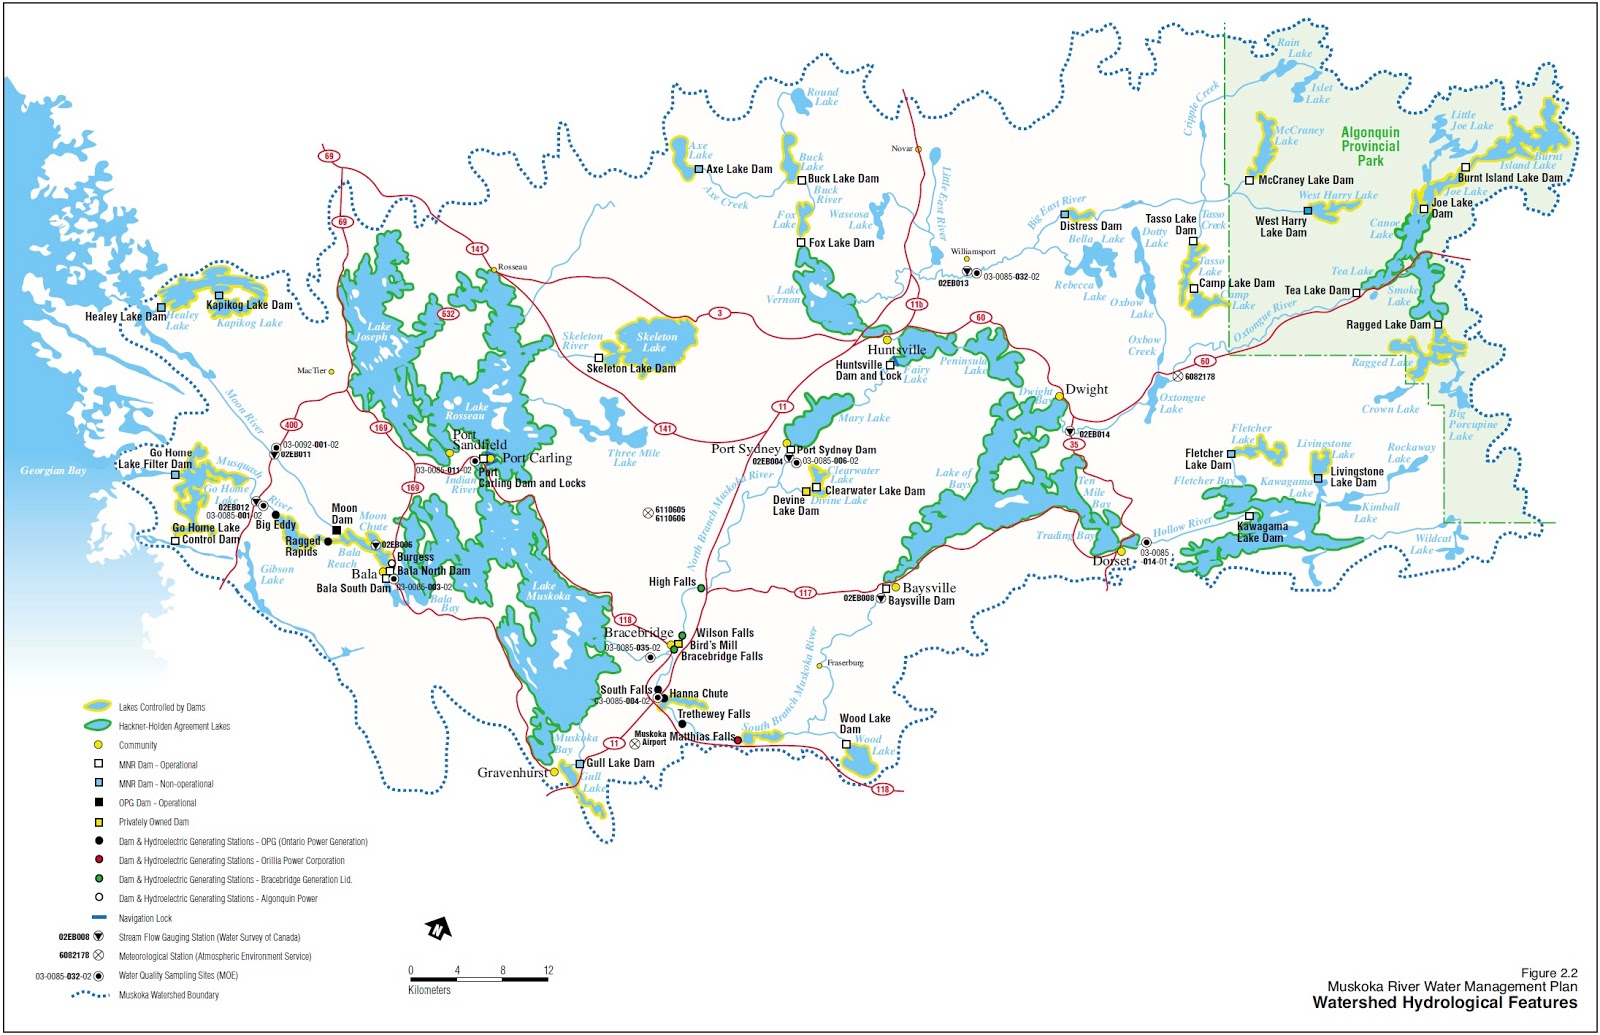
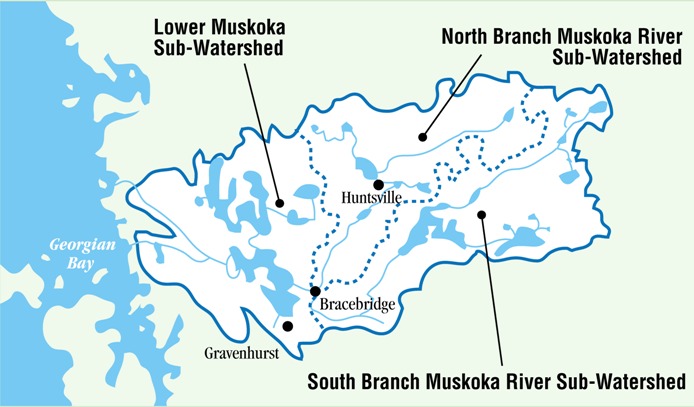
Algonquin Park is top right, Georgian Bay bottom left and in between Muskoka. The image needs to be seriously blown up to understand that this entire thing is connected but for simplicity sake Algonquin is higher and the run off goes down through it all into Georgian Bay. Lake Muskoka is the big bathtub in the middle and when it can’t water down the drain in Bala to moon river fast enough it backs up into Joe and Rosseau. The reason Lake Muskoka notices the effects more than anyone else is because there are 2 routes from Algonquin ie the North and South watersheds or as we say rivers so we get a double whammy on the in, and with only one drain out (Bala) if we can’t get it out faster than it comes in Muskoka overflows into Lake Rosseau and then Lake Joe which is exactly what happened in 2013 and 2016!
Circling back to the point here the MNR decides what to do based on the local snowpack?! I shouldn’t even have to say WTF – if snow melts and water is the result why on earth would you JUST measure off the local snowpack and not look UPSTREAM ie to the top of the hill or where it starts. Sure it was a horrible sledding winter in Muskoka because of the lack of winter, but did they not see the sleds on trailers heading north to ride?! Winter happened in Algonquin.
Q3: What day do you decide how much to draw down?
A3: MARCH 15th.
- If the snow water content is >25% above normal on March 15 on the North Branch of the Muskoka River, lakes controlled by MNR will be lowered to the bottom of the NOZ.
- If snow pack water content is >50% above normal on March 15 on the South Branch of the Muskoka River, lakes controlled by MNR will be lowered to the bottom of the NOZ.
- If snow pack water content is >100% above normal on April 1 on both branches of the Muskoka River, lakes controlled by MNR will be lowered to the bottom of the LOZ (red line).
In 2014 and 2015 the lakes were drawn down to the bottom of the NOZ both years as they both had >25% above normal snow water content early in the season which carried through the March 15th draw down trigger date. Both winters were unusually cold with the freshet beginning around mid-April. This year there was no measureable snow on the ground until the middle of January and water content in the snow pack was consistently about 20-30% below normal through the rest of the winter until the spring melt began with warmer than normal temperatures beginning in early March. This being the case MNRF attempted to follow the target operating line as per the management plan through winter 2016.
True Story: on March 16th I literally looked at the lake level chart online and said to my husband “the lake has WAY too much water in it now, like 2 feet too much!! There is no way we aren’t going to flood.”
Apparently instead of reading their own charts when that spring like weather surfaced early March and proactively doing something about lake levels they were outside tanning! Back to remembering the better part of Muskoka we all go – and my pretty path to the back dock not looking like this (ugh!)
#muskokamakeover coming up next!
Note: our first flood post was read all over the world. I don’t have to tell you, from one cottager to the next, that Muskoka is an incredibly special place to us all. The MLA has started an aggressive task force that’s meeting every few days with all the right folks but you can do your part by showing support online too. If you’re into petitions this one needs WAY more signatures; otherwise just like, share and retweet posts that mention muskoka flooding and be sure to include #muskoka in it. Do your part to help avoid the floods of 2017, 18, 19 etc.
Follow us on Instagram, Facebook & Twitter for live updates.
Leave A Comment