If you follow us on Instagram or Facebook our predictions about flooding on Lake Muskoka for Spring 2019 are now a reality. Here are the facts as at April 23, 2019 (11 am)
Coles Notes:
- Water in Muskoka = connected.
- For months we’ve been talking about the insane amount of snow and ice in lakes not only in South Muskoka but to our North and East. Using a A + B = C logic it didn’t take much for us to predict a flood would occur in February
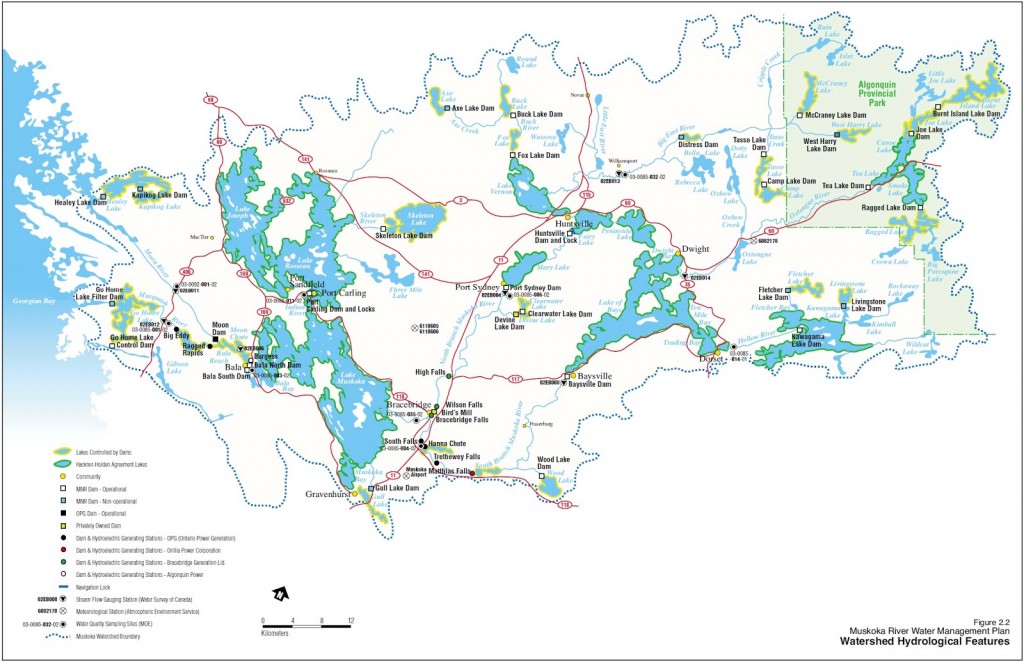
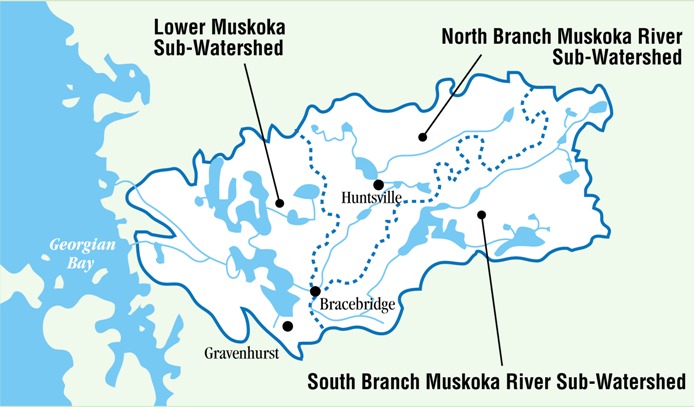
- Recall Lake Muskoka is the bathtub in the middle of Algonquin and Georgian Bay. The spring freshet from the North, South & Lower Muskoka watersheds all pass through and exit at Bala. With 2 entrances and 1 exit we don’t simply stand a chance, and when the water has nowhere else to go Lake Muskoka backs up into Rosseau and Joe.
- The MNR controls the Lake Level using the following formula
- If the snow water content is >25% above normal on March 15 on the North Branch of the Muskoka River, lakes controlled by MNR will be lowered to the bottom of the Normal Operating Zone (NOZ).
- If snow pack water content is >50% above normal on March 15 on the South Branch of the Muskoka River, lakes controlled by MNR will be lowered to the bottom of the NOZ.
- If snow pack water content is >100% above normal on April 1 on both branches of the Muskoka River, lakes controlled by MNR will be lowered to the bottom of the LOZ (red line).
Snow courses are now sampled at 5 locations across Muskoka all winter, and they told me they have been closely monitoring snowpack levels across the District. Measurements are also sampled in Algonquin and they are in regular contact with their sampling and operations teams. What’s changed is that the MNR is NOT to blame for this flood. In the 6 years that Muskoka flooding has been a thing, they’ve heard everyone loud and clear and they have been proactively adjusting our lake levels.
The issue is it’s a fine science. Just like any game of cards, there are odds and when you’re battling Mother Nature you can only take so much risk. What’s remained constant in the last 6 years is the Normal Operating Zone markers (those two red lines in the chart below mark the top and bottom).
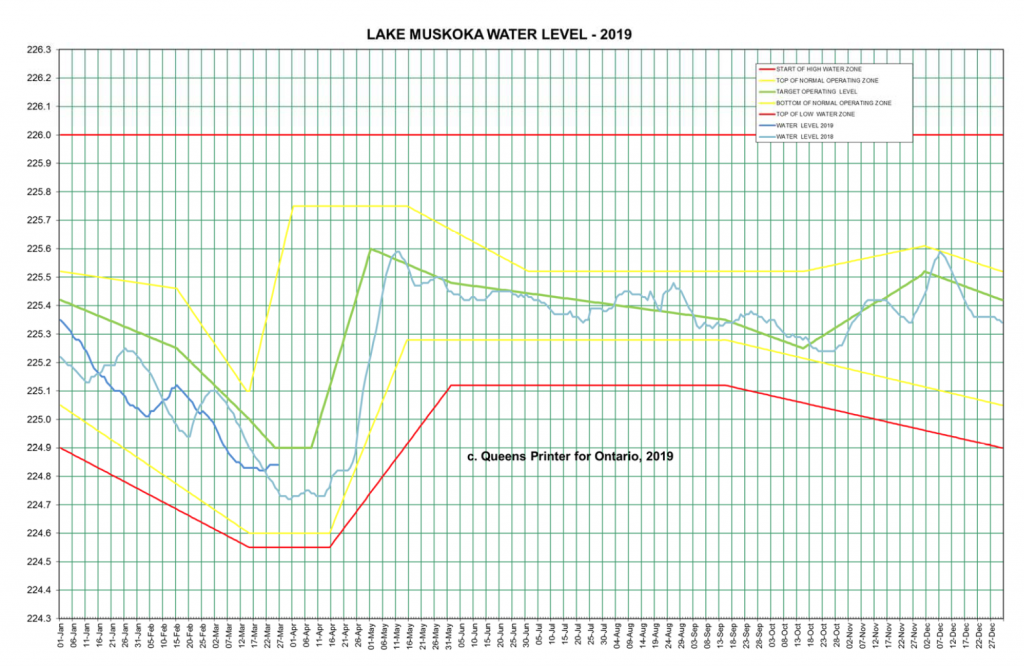
If they take any more water out of the lake then the red line dictates the risk is that we’ll all be complaining, not to mention be boating around hitting new rocks and islands all summer long. Weigh the two weeks of high water and potential damage vs. an entire summer of low lake levels and I’m sure you can sympathize.
At the end of March 2019, the MNR was making efforts to draw down Muskoka further but things were stalled due to melting activity upstream. They were successful drawing some of the upper lakes to their targets and hold flows steady there, so Lake Muskoka started dropping early April. We’re awaiting a current chart as the above is from March 27, 2019 but we can report that the dark blue line above plummeted right down to the bottom of the NOZ shortly thereafter and the MNR drew down as far as they possibly could for spring 2019. This flood is simply mother nature flexing her mighty powers.
At the other end of the watershed we also did receive confirmation The Bala dam project does not impact operations of water drawdowns at Bala, and their coffer dam was removed in late February. Dams have been opened up to their max capacity since March 15th 2019.
Key Metrics & Dates:
- Ice out for Lake Muskoka over the last 100 years is historically April 21st; last year the ice went out April 30th
- The top of our dock (which isn’t a low dock) sits at 384″
- Normal water levels for this time of year is around the 374″ mark ( that’s the level the Lake needs to return to before Marina’s are able to safely start putting your boats in!)
Flood Facts:
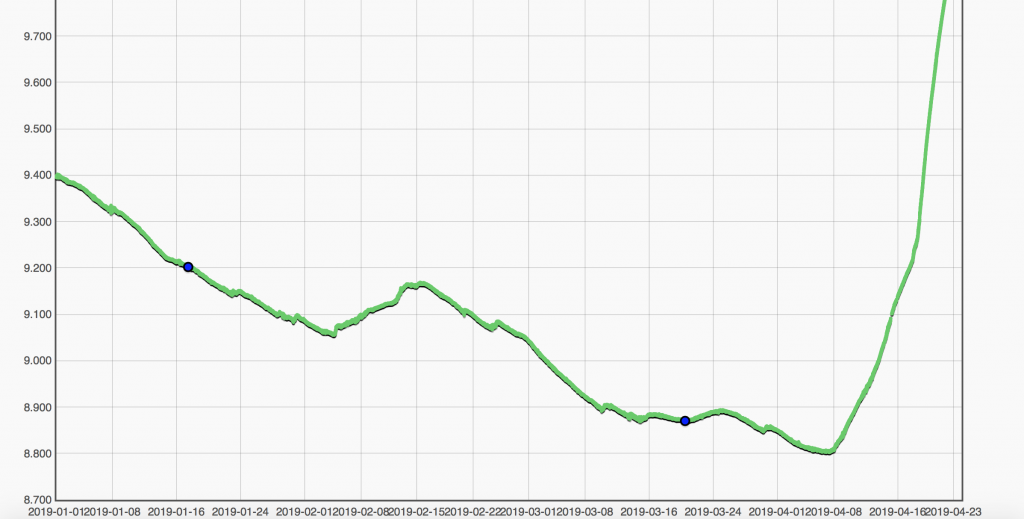
The following graph is Lake Muskoka water levels from Jan 1, 2019 to today (April 23, 2019)
2019 Flood Status:
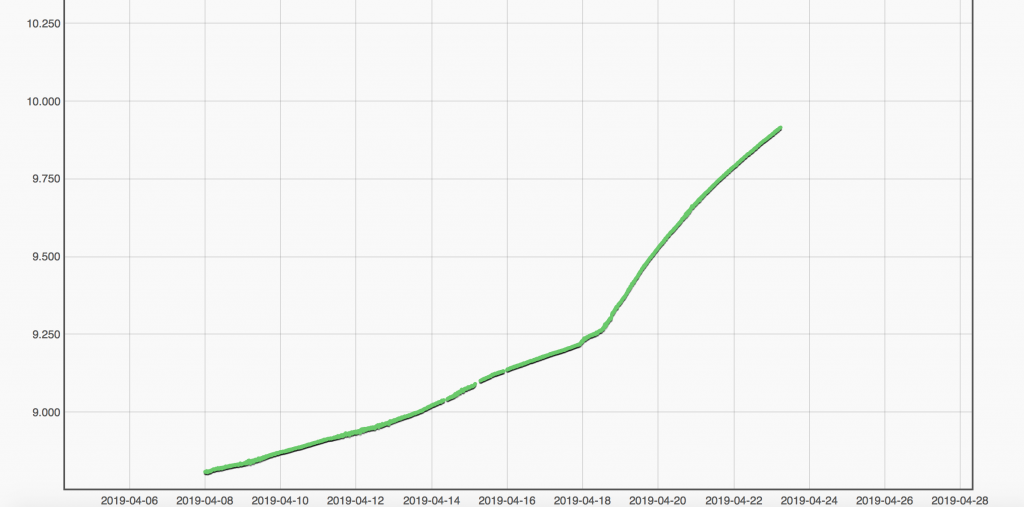
- Lake Muskoka water level is at 390.39″ as of April 23rd 11 am
- That’s 44″ of water in 15 days, with 2ft of that arriving over the Easter long weekend
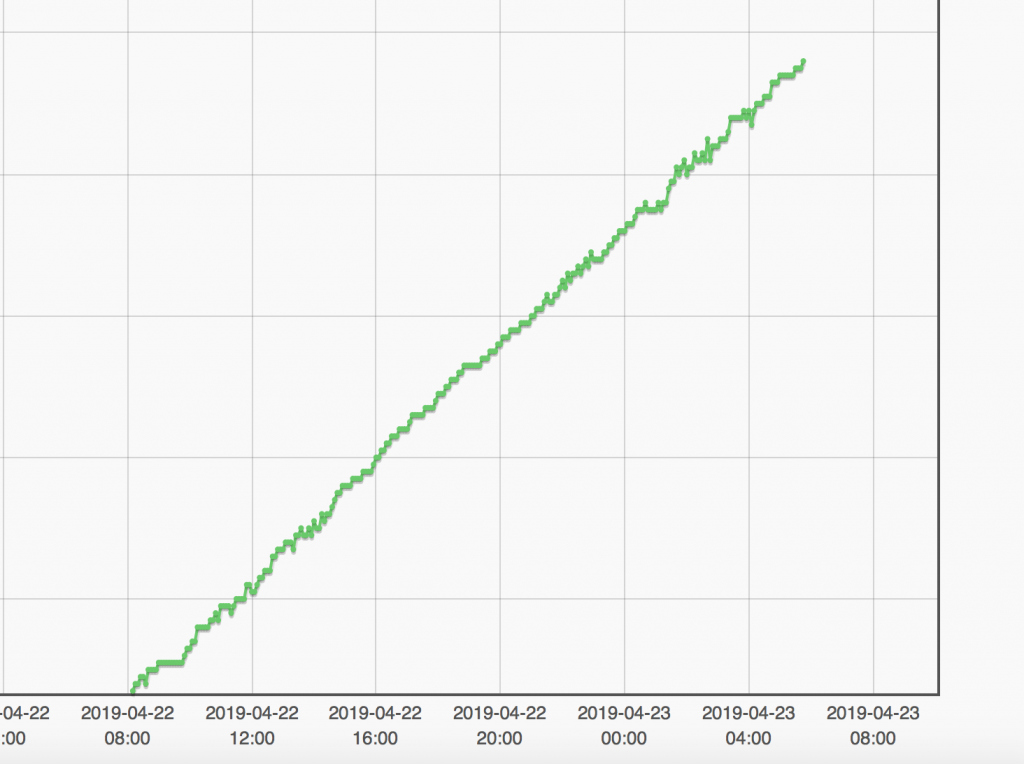
- In the last 24 hours water has risen another 5″
Here’s what has happened to Lake Muskoka water levels since April 8th, the lowest point for the Spring 2019 drawdown.
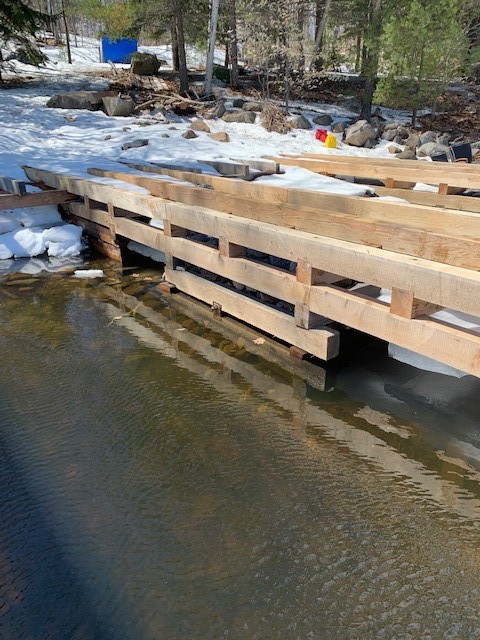
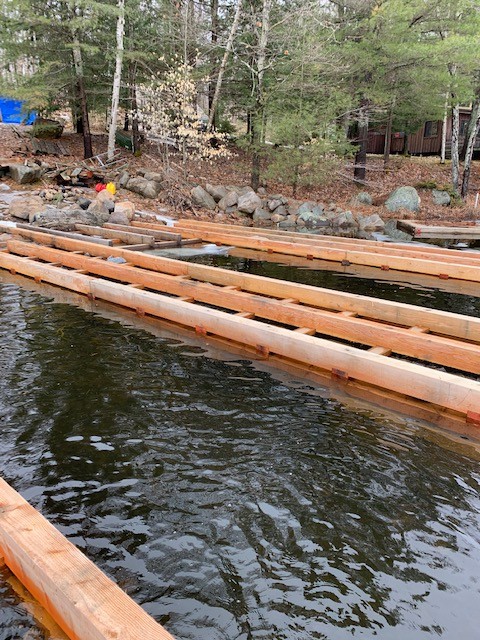
- It’s crazy to think about how large Lake Muskoka is and that it takes 30+ minutes to boat from one end to the other and the entire lake is going up so quickly but alas the proof is in the pictures and its easier to see on a new dock
April 13
April 22
You can watch for yourself here (at Beaumaris) but look at the visual of the last 24 hours alone!
Safe to assume your dock is now underwater and if not will be by the end of the day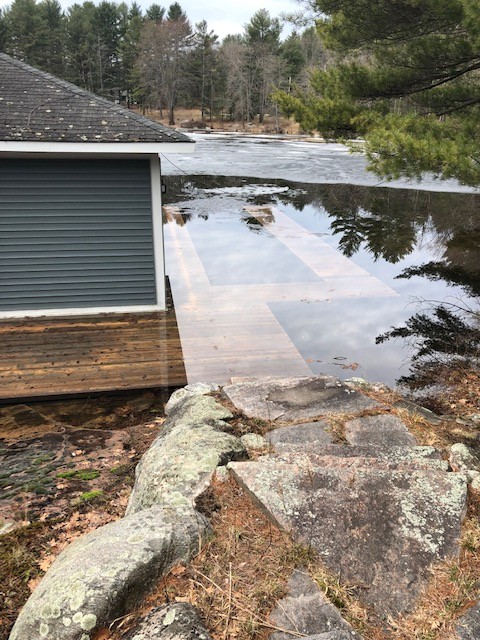
- There is now massive flooding in downtown Huntsville and that all flows to Bracebridge so is en route
- We are now 1 ft shy of the 2013 flood record (402″)
- There is little doubt that we’ll surpass it in the next few days
The Big Concern= ICE
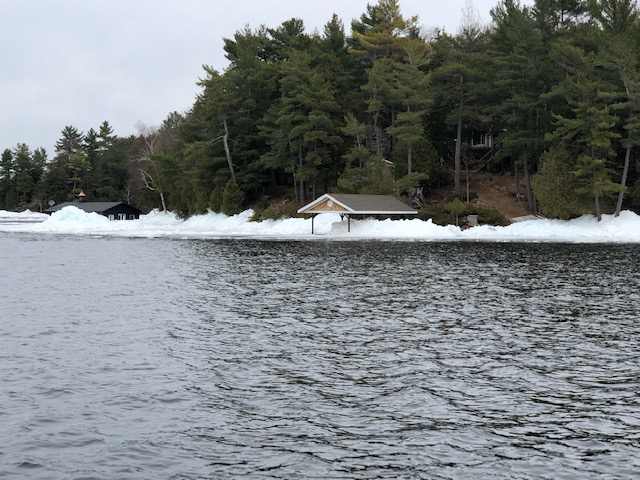
That being said the water moving through will be what it will be. Our only concern at this point is the thickness of the ICE still in Lake Muskoka. The last time we checked and drilled was 2 weeks ago when it was still safe to go on it and it was 24″ thick. We’ve had alot of rain and warmer temperatures which are a blessing but what we can NOT afford to have this week is WIND. In the past we only had 4-6″ of ice and that wreaked havoc on docks on break up. While we can’t say for certain we’re currently seeing chunks near shore that are 6″ and have been open for some time. Here’s a chunk we retrieved from a bubbler opening.
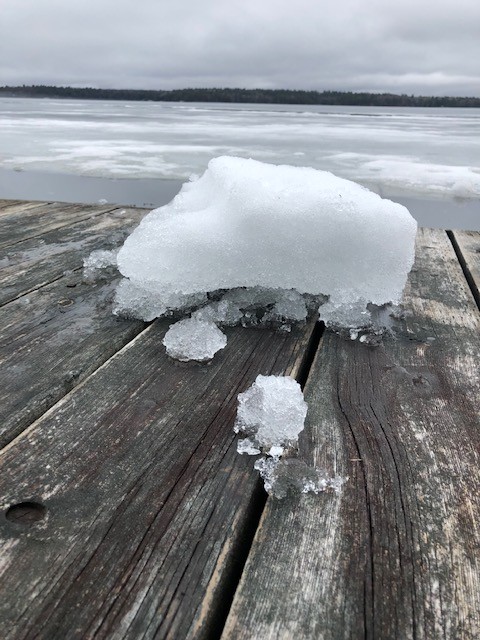
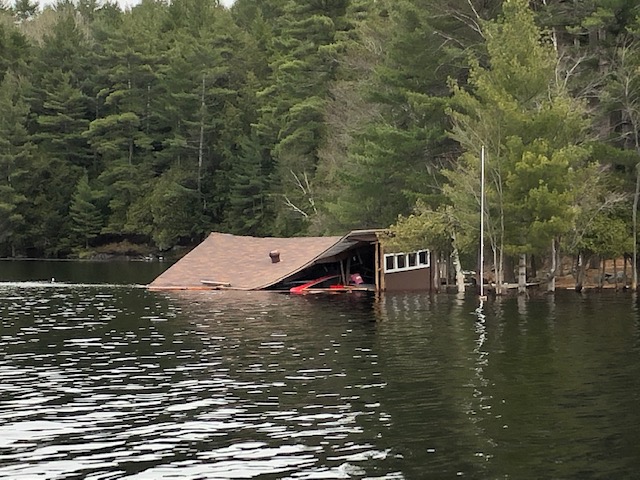
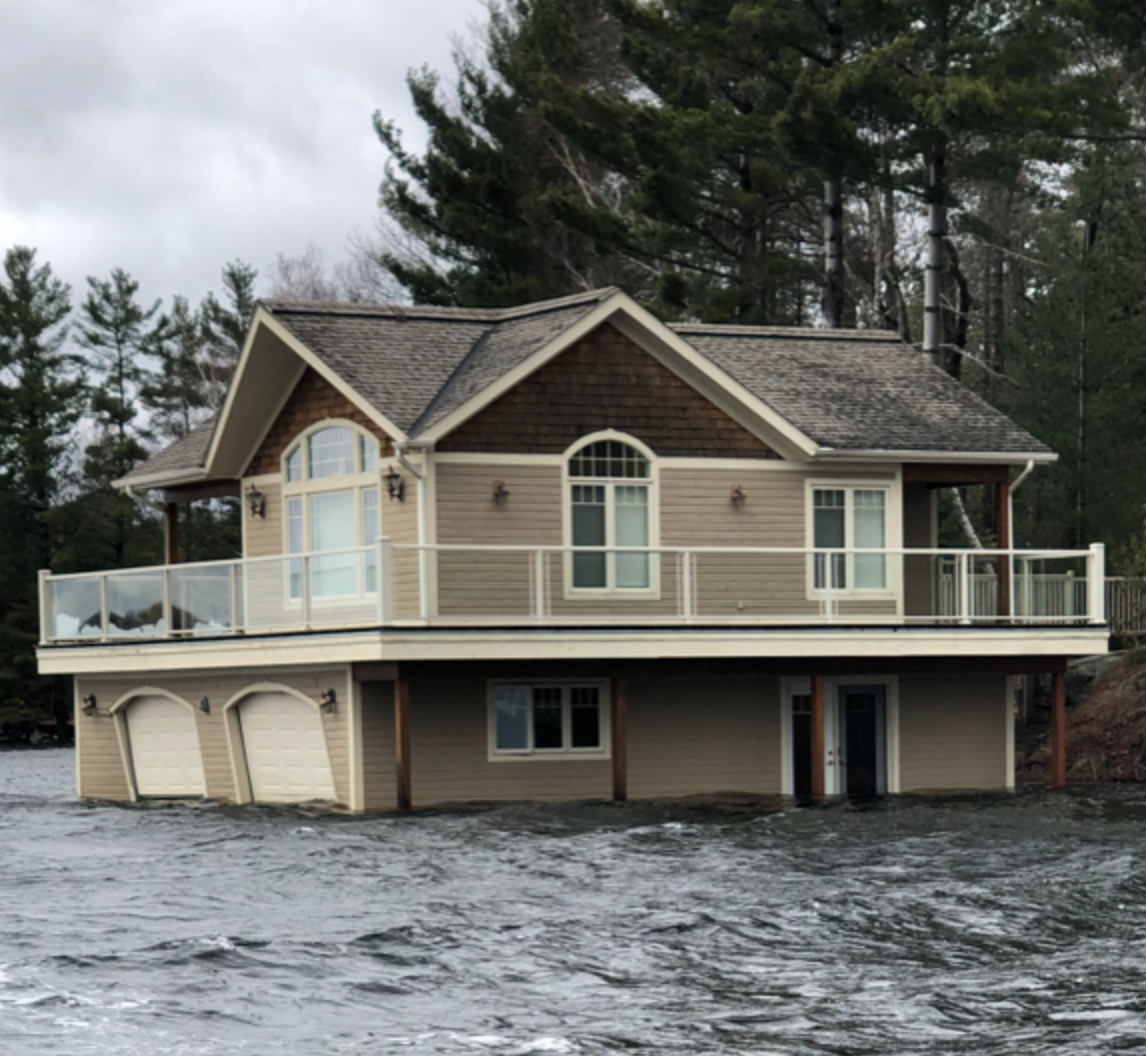
Based on what we’ve been seeing (deer still standing on lake!) we’re guessing that ice on Lake Muskoka is still between 12 and 18″ thick. Big chunks of ice and any sort of wind have the potential to do an insane amount of destruction to docks and boathouses.

Cross your fingers and hope for sunshine and warmer overnight temperatures. We’re monitoring the situation closely but you can be sure we’ll be posting about it daily until Lake Muskoka peaks on our Instagram or Facebook feeds so follow along.
#muskokaflood2019

mnr did not let enough water out in winter. normal summer levels in march!
Close to Taboo Resort, we have 15″ deep off our dock. For 65 years, every winter(except 2013) I can walk out in mud approx. 20 yards in our bay (no snow and no water). Therefore,
normally water in Lake Muskoka is down about 2 feet at early March. This year it was at normal summer time levels as the ice started to retreat. MNR did not lower the levels as reported.
Once the dams were opened (after Huntsville flooded) the water gushed down the Muskoka River (north branch) and flooded.
The point is the Muskoka lakes were not lowered sufficiently.
Really been enjoying your updates – thank you for the incredible work. I have to say, I crunched the data at Beaumaris station as well and the trend is alarming. About 2 feet higher/faster fill rate between Feb & May from 2002 to 2017. So while there is a Water Management plan, the plan addresses lake levels but not watershed melt speed increase. Add snow quantity & rain and we are doomed… MRWMP revision is critical for all of us residents here. On the bright side, it sounds like until then, you’ll have reno work for years to come…
Thanks for letting us know the imperical evidence
Most welcome – data helps all process
Really been enjoying your updates – thank you for the incredible work. I have to say, I crunched the data at Beaumaris station as well and the trend is alarming. About 2 feet higher/faster fill rate between Feb & May from 2002 to 2017. So while there is a Water Management plan, the plan addresses lake levels but not watershed melt speed increase. Add snow quantity & rain and we are doomed… MRWMP revision is critical for all of us residents here. On the bright side, it sounds like until then, you’ll have reno work for years to come…